TITLE>GKG Thematic Timeline: GDELT Analysis Service

GKG Thematic Timeline Visualizer

GKG Timeline Visualizer

Dataset: Global Knowledge Graph

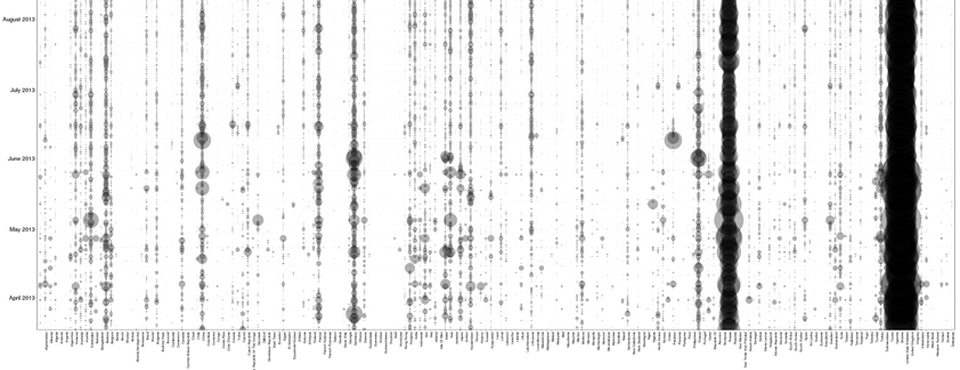
Description: Creates a unique gridded timeline showing intensity by day of each GKG theme - Y axis is day and X axis is each GKG theme, making correlations among themes instantly visible.

Components: PERL, R

Example: Timelines of Countries and of Themes

The GKG Thematic Timeline Visualizer allows you to create a unique gridded timeline visualization from the GDELT Global Knowledge Graph (GKG) to understand temporal patterns in the thematic undercurrents of your search. In this visualization the X axis represents each GKG theme, while the Y axis represents each day of the data (currently this only goes back to April 1, 2013 for the GKG). Thus, rows represent each day and columns represent a given GKG theme across days. At each grid cell a semi-transparent dot is displayed, sized based on the percentage of all GKG records from that date matching your search criteria that contained that theme (thus these timelines are normalized against GDELT's exponential growth over time). The compact nature of this visualization allows you to spot temporal patterns at the daily level, whereas with a traditional barchart or line graph timeline, the individual bars or line points would be too small with this many points to see anything. In addition, the unique gridded nature of this visualization allows you to rapidly spot weak temporal correlations among themes. For taxonomic themes, only the root theme is displayed.

No programming or technical skills are required to use this timeline visualization - you simply specify a set of person or organization names, locations, or Global Knowledge Graph Themes, along with an optional date range, and the system will automatically search the entire Global Knowledge Graph for all matching entries and compile the final timeline. Your results will be emailed to you when complete, usually within 10 minutes, depending on server load and the time it takes to perform the necessary calculations. All GDELT Global Knowledge Graph records are scanned for your search parameters and the average prevalance of matching records is averaged by day. Thus, selecting "Nigeria" as your search criteria will generate a timeline of what percentage of each day's coverage of Nigeria mentioned each GKG theme, as well as a .CSV file with the results for import to an external statistical package.

Your Email Address

Creating these results can take several minutes depending on server demand - please provide the email address that the results should be sent to.

Email Address

Date Range

Limit the time period of analysis. The earliest allowable date for the Global Knowledge graph is currently April 1, 2013 and the latest date allowed is the current day.

Start Date
End Date
 

Keyword Search Criteria

You must specify a set of keywords that will be used to search the Global Knowledge Graph for matching records. Separate multiple terms with commas. The three fields are boolean AND'd together, so to search for discussion of Food or Water Security in Nigeria and to exclude any mentions of US President Obama or Edward Snowden, you would enter "Nigeria" in the first field, "WATER_SECURITY, FOOD_SECURITY" in the second, and "Barack Obama, Edward Snowden" in the third. Fields are not case sensitive.

All GKG fields are searched for these keywords, so you can use a combination of person and organization names, countries and cities, and GKG Themes. NOTE that this does NOT search article fulltext, only the extracted GKG fields.

Include ALL OF

Include AT LEAST ONE OF

Must NOT Have ANY OF

Intensity Weighting

How should the intensity of each theme on each day calculated?

  • Number Namesets As the GDELT Global Knowledge Graph processes each news article it extracts a list of all people, organizations, locations, and themes from that article and concatenates them together to form a unique "key" that represents that particular combination of names, locations, and themes. All articles containing that same unique combination of names, locations, and themes, regardless of how similar the rest of the text is, are grouped together into a "nameset". This option essentially weights each day's discussion of a theme towards those that occur in the greatest diversity of contexts, biasing towards the most discussed themes that occur frequently in many contexts. It is relatively immune to sudden massive bursts of coverage (such as from a major sudden situation) and instead tends to capture the broadest temporal trends.
  • Number Articles This option bases the weights on the raw number of articles a given theme occurs in on a given day. This option essentially weights each day's discussion of each theme towards those that occur the most frequently, even if they always occur with the same set of names, biasing towards frequency rather than uniqueness. It can be highly sensitive to sudden massive bursts of coverage (such as from a major sudden situation) and so should be used with care, but can yield a more nuanced and detailed picture of temporal trends, especially short-term temporal focus.

Outputs

The following output files will be generated:

  • Thematic Timeline Visualization Generates a static gridded thematic timeline visualization as a .PNG image.
  • .CSV File This outputs a .CSV file containing a normalized intensity of matching GKG records per day. This is normalized by the total volume of all GKG records for that day. The spreadsheet has three columns - the first is the date in YYYYMMDD format, the second is a given GKG theme, and the third is the percent of all GKG records from that day matching your search criteria that contained that theme.