GKG Geographic Network Visualizer

GKG Geographic Network Visualizer

Dataset: Global Knowledge Graph

Description: Creates a geographic network of the cities and landmarks most closely associated with a search and their co-occurances and produces a set of images and georeferenced network files.

Components: PERL, GraphViz

Acknowledgements: Makes use of GraphViz to create the preview images.

Examples: Geographic Networks: Contextualizing Relationships in Space

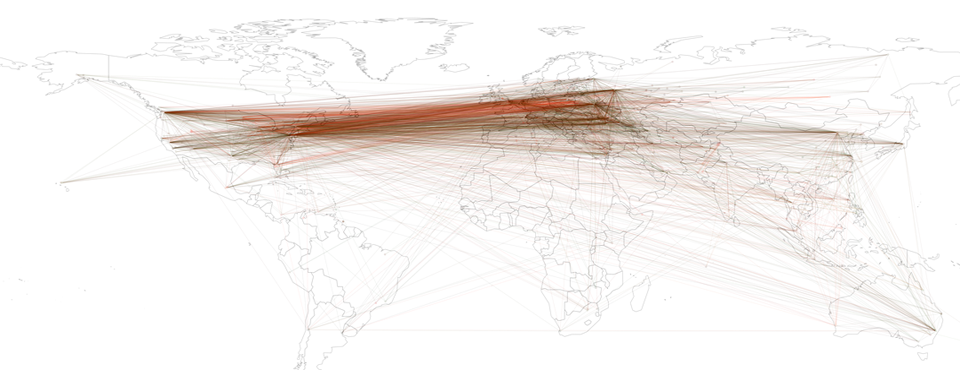
The GKG Geographic Network Visualizer allows you to rapidly construct georeferenced networks from the GDELT Global Knowledge Graph (GKG) to understand spatial connectivity in your search, and creates a set of visualizations and output files. All GKG records are scanned for your search criteria and a list compiled of all of the city, landmark, and administrative division (roughly equivalent to a US state) locations found in each record, along with which city, landmark, and administrative divisions each co-occurs with. The end result is a georeferenced network diagram that captures not only the spatial affinity of a given search, but also uniquely its spatial connectivity, exploring not just what locations are most closely associated with a search, but also how those locations are themselves connected to all other locations. Two preview images are created, one with white edges drawn on a black background to make the overall structure of the network immediately clear, while the other colors each location and edge by its tone, from bright red (high negativity) to bright green (high positivity), offering the ability to see how certain locations are paired in more negative or more positive lights. A Google Earth .KML file allows you to load the network into Google Earth, including all of the connections among locations. A special Gephi .GEXF file is generated that encodes the latitude and longitude information of the network and the coloring of each edge, suitable for layout through Gephi's Geo layout algorithm. Finally, two GraphViz .DOT files are created that can be loaded into a number of different network analysis packages or rendered using GraphViz to produce the two preview images.

No programming or technical skills are required to use this heatmap visualization - you simply specify a set of person or organization names, locations, or Global Knowledge Graph Themes, along with an optional date range, and the system will automatically search the entire Global Knowledge Graph for all matching entries and compile the final georeferenced network diagram. Your results will be emailed to you when complete, usually within 10 minutes, depending on server load and the time it takes to perform the necessary calculations. All GDELT Global Knowledge Graph records are scanned for your search parameters and a geographic network compiled of the locations found across all matching records. Thus, selecting "Vladimir Putin" as your search criteria will generate a network diagram of all of the locations across the world most closely associated with him and their respective co-occurances.

Your Email Address

Creating these results can take several minutes depending on server demand - please provide the email address that the results should be sent to.

Email Address

Date Range

Limit the time period of analysis. The earliest allowable date for the Global Knowledge graph is currently April 1, 2013 and the latest date allowed is the current day.

Start Date
End Date
 

Keyword Search Criteria

You must specify a set of keywords that will be used to search the Global Knowledge Graph for matching records. Separate multiple terms with commas. The three fields are boolean AND'd together, so to search for discussion of Food or Water Security in Nigeria and to exclude any mentions of US President Obama or Edward Snowden, you would enter "Nigeria" in the first field, "WATER_SECURITY, FOOD_SECURITY" in the second, and "Barack Obama, Edward Snowden" in the third. Fields are not case sensitive.

All GKG fields are searched for these keywords, so you can use a combination of person and organization names, countries and cities, and GKG Themes. NOTE that this does NOT search article fulltext, only the extracted GKG fields.

Include ALL OF

Include AT LEAST ONE OF

Must NOT Have ANY OF

Node/Edge Weighting

How should the popularity of nodes and the "strength" of the connection between nodes be measured?

  • Number Namesets As the GDELT Global Knowledge Graph processes each news article it extracts a list of all people, organizations, locations, and themes from that article and concatenates them together to form a unique "key" that represents that particular combination of names, locations, and themes. All articles containing that same unique combination of names, locations, and themes, regardless of how similar the rest of the text is, are grouped together into a "nameset". Selecting this edge weighting option means that the "Node Cutoff" option below determines how many unique namesets a given name/theme/location must occur in before it is counted, while the "Edge Cutoff" similarly refers to the number of unique namesets that a pair of names/themes/locations must appear together in before that edge is counted. This option essentially weights nodes and edges towards those that occur in the greatest diversity of contexts, biasing towards public figures and those who occur frequently with many other people. It is relatively immune to sudden massive bursts of coverage that only lasts a day or two (such as from a major sudden situation) and instead tends to capture the broadest trends in the network.
  • Number Articles This option bases the weights on the raw number of articles a given name/theme/location occurs in or co-occurs with another name/theme/location in. Selecting this edge weighting option means that the "Node Cutoff" option below determines how many total articles a given name/theme/location must occur in before it is counted, while the "Edge Cutoff" similarly refers to the number of articles that a pair of names/themes/locations must appear together in before that edge is counted. This option essentially weights nodes and edges towards those that occur the most frequently, even if they always occur with the same set of names, biasing towards frequency rather than uniqueness. It can be highly sensitive to sudden massive bursts of coverage that only lasts a day or two (such as from a major sudden situation) and so should be used with care, but can yield a more nuanced and detailed picture of a network.

Cutoff Thresholds

If your network ends up being too large or too small, you may decide to adjust the cutoff thresholds below. Node Cutoff sets how many times a name must appear before it is included in the graph, while Edge Cutoff sets how many times a pair of names must appear together before they are connected in the network. The counts measured by these cutoffs are affected by your selection in the Edge Weighting section above.

Node Cutoff
Edge Cutoff
 

Outputs

The following output files will be generated:

  • Google Earth .KML File This outputs a .KML file that can be opened in Google Earth that color-codes each city and connection among them from bright red (strongly negative) to bright green (strongly positive). These files are usually too large to be previewed in Google Maps, but the free edition of Google Earth (https://www.google.com/earth/) can display them easily. They can also be loaded into many GIS applications.
  • Geographic Gephi File This outputs a Gephi .GEXF file that color-codes each city and connection among them from bright red (strongly negative) to bright green (strongly positive). The file includes special latitude and longitude attributes on each node and the new GEXF version 1.2 edge coloring to allow network links to be colored according to tone. If you install Gephi's "Geo" layout algorithm you can render this in map format directly in Gephi.
  • Tone Network .DOT Graphviz File Generates a .DOT file in the Graphviz file format that color-codes each city and connection among them from bright red (strongly negative) to bright green (strongly positive). This file can be directly imported into GraphViz's "neato" utility for rendering or into any package that supports the .DOT format for further analysis.
  • Tone Network Preview Image Generates a .PNG preview image of the Tone Network, rendered using GraphViz. Nodes and edges are made semi-transparent so that only the strongest connections are visible.
  • Intensity Network .DOT Graphviz File Generates a .DOT file in the Graphviz file format that records each city and connection among them. Nodes and edges are NOT color-coded, they are designed to render out as white lines that can be overlaid onto a dark map. This map makes macro-level spatial patterns easiesr to spot than the tone map above. This file can be directly imported into GraphViz's "neato" utility for rendering or into any package that supports the .DOT format for further analysis.
  • Intensity Network Preview Image Generates a .PNG preview image of the Intensity Network, rendered using GraphViz. Nodes and edges are made semi-transparent so that only the strongest connections are visible. Black background makes it easier to spot macro-level patterns.