GKG Heatmap Visualizer

GKG Heatmap Visualizer

Dataset: Global Knowledge Graph

Description: Creates an interactive heatmap that displays in a browser window, along with a CSV file for importing into GIS software.

Components: PERL, heatmap.js, Google Maps

Acknowledgements: Makes use of the heatmap.js library.

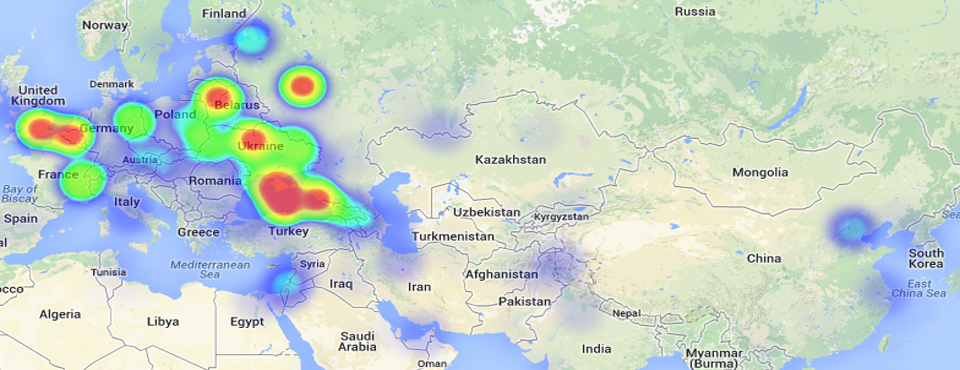
Example: Heatmapping Hotspots.

The GKG Heatmap Visualizer allows you to rapidly construct geographic heatmaps from the GDELT Global Knowledge Graph (GKG) to understand spatial patterns in your search, and creates an interactive browser-based heatmap display and Latitude/Longitude .CSV file for more sophisticated analysis and visualization using GIS software. All GKG records are scanned for your search criteria and a list compiled of all of the city, landmark, and administrative division (roughly equivalent to a US state) locations found in each record, which is then compiled to make a master histogram by latitude/longitude of the top locations associated with your search. This is then output in a live browser-based heatmap visualization and a .CSV file that you can readily import into GIS software for more sophisticated visualization and spatial analysis.

No programming or technical skills are required to use this heatmap visualization - you simply specify a set of person or organization names, locations, or Global Knowledge Graph Themes, along with an optional date range, and the system will automatically search the entire Global Knowledge Graph for all matching entries and compile the final timeline. Your results will be emailed to you when complete, usually within 10 minutes, depending on server load and the time it takes to perform the necessary calculations. All GDELT Global Knowledge Graph records are scanned for your search parameters and a histogram compiled of the locations found across all matching records. Thus, selecting "Vladimir Putin" as your search criteria will generate a heatmap of all of the locations across the world most closely associated with him, as well as a .CSV file with the results for import to an external GIS package.

Your Email Address

Creating these results can take several minutes depending on server demand - please provide the email address that the results should be sent to.

Email Address

Date Range

Limit the time period of analysis. The earliest allowable date for the Global Knowledge graph is currently April 1, 2013 and the latest date allowed is the current day.

Start Date
End Date
 

Keyword Search Criteria

You must specify a set of keywords that will be used to search the Global Knowledge Graph for matching records. Separate multiple terms with commas. The three fields are boolean AND'd together, so to search for discussion of Food or Water Security in Nigeria and to exclude any mentions of US President Obama or Edward Snowden, you would enter "Nigeria" in the first field, "WATER_SECURITY, FOOD_SECURITY" in the second, and "Barack Obama, Edward Snowden" in the third. Fields are not case sensitive.

All GKG fields are searched for these keywords, so you can use a combination of person and organization names, countries and cities, and GKG Themes. NOTE that this does NOT search article fulltext, only the extracted GKG fields.

Include ALL OF

Include AT LEAST ONE OF

Must NOT Have ANY OF

Location Weighting

How should the "weight" of each location be calculated?

  • Number Namesets As the GDELT Global Knowledge Graph processes each news article it extracts a list of all people, organizations, locations, and themes from that article and concatenates them together to form a unique "key" that represents that particular combination of names, locations, and themes. All articles containing that same unique combination of names, locations, and themes, regardless of how similar the rest of the text is, are grouped together into a "nameset". This option essentially weights locations towards those that occur in the greatest diversity of contexts, biasing towards the most discussed locations and those that occur frequently in many contexts. It is relatively immune to sudden massive bursts of coverage that only lasts a day or two (such as from a major sudden situation) and instead tends to capture the broadest spatial trends.
  • Number Articles This option bases the weights on the raw number of articles a given location occurs in. This option essentially weights locations towards those that occur the most frequently, even if they always occur with the same set of names, biasing towards frequency rather than uniqueness. It can be highly sensitive to sudden massive bursts of coverage that only lasts a day or two (such as from a major sudden situation) and so should be used with care, but can yield a more nuanced and detailed picture of spatial trends, especially short-term spatial focus.

Outputs

The following output files will be generated:

  • Interactive Heatmap Visualization Generates a ready-to-go heatmap visualization using the heatmap.js library that displays inside of your browser overlaid onto Google Maps. A horizontal slider in the upper-left of the visualization allows you to interactively adjust the upper cutpoint threshold of the heatmap to dynamically "slice" through the data.
  • .CSV File This outputs a .CSV file listing the unique latitude/longitude pairs found across all matching GKG records and the number of matching GKG records or articles for each. This can be imported into GIS software for more sophisticated visualization or analysis.
    NOTE: The CSV file also contains an additional column that records the average "tone" (ranging +100 for most positive to -100 for most negative) of all matching news coverage that mentioned that location. This can be used with specialized software to create "emotional" heatmaps. The tone column is currently ignored for the web-based interactive heatmap visualization above and is provided only for possible use with external software.