GKG Tone Timeline Visualizer

GKG Tone Timeline Visualizer

Dataset: Global Knowledge Graph

Description: Creates a timeline of the smoothed average tone by day of a search, along with a CSV file for importing into external software.

Components: PERL, R

Acknowledgements: Makes use of tools from the GDELT World Leaders Index.

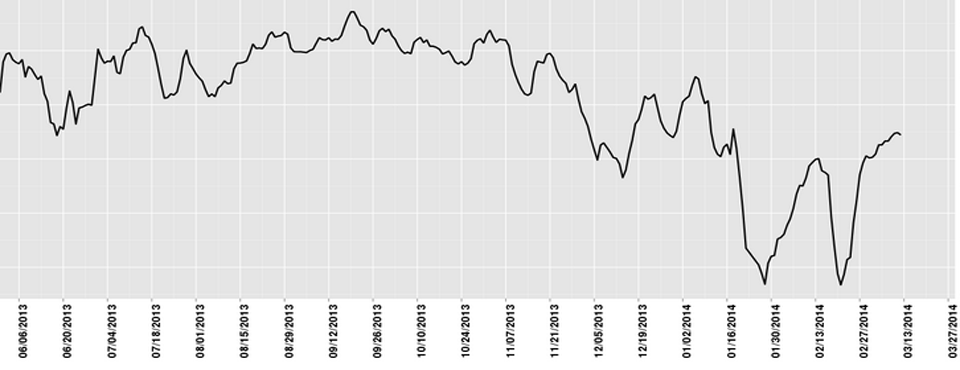
Example: Timelining Tone.

The GKG Tone Timeline Visualizer allows you to plot the average "tone" from extremely positive to extremely negative over a search of the GDELT Global Knowledge Graph (GKG), creating a beautiful publication-ready visualization of how emotion is changing over time and outputting a .CSV file that can be imported into other statistical and visualization packages for further analysis. No programming or technical skills are required - you simply specify a set of person or organization names, locations, or Global Knowledge Graph Themes, along with an optional date range, along with which field you would like to visualize (names, organization, locations, or themes) and the system will automatically search the entire Global Knowledge Graph for all matching entries and calculate the average tone, from extremely positive, to extremely negative, of the results by day over time. Your results will be emailed to you when complete, usually within 10 minutes, depending on server load and the time it takes to perform the analysis.

All GDELT Global Knowledge Graph records are scanned for your search parameters and the average emotion of the underlying records is averaged by day. Thus, selecting "Nigeria" as your search criteria will generate a timeline of how the tone of coverage of Nigeria has changed over time, as well as a .CSV file with the results for import to an external statistical package.

Your Email Address

Creating these results can take several minutes depending on server demand - please provide the email address that the results should be sent to.

Email Address

Date Range

Limit the time period of analysis. The earliest allowable date for the Global Knowledge graph is currently April 1, 2013 and the latest date allowed is the current day.

Start Date
End Date
 

Keyword Search Criteria

You must specify a set of keywords that will be used to search the Global Knowledge Graph for matching records. Separate multiple terms with commas. The three fields are boolean AND'd together, so to search for discussion of Food or Water Security in Nigeria and to exclude any mentions of US President Obama or Edward Snowden, you would enter "Nigeria" in the first field, "WATER_SECURITY, FOOD_SECURITY" in the second, and "Barack Obama, Edward Snowden" in the third. Fields are not case sensitive.

All GKG fields are searched for these keywords, so you can use a combination of person and organization names, countries and cities, and GKG Themes. NOTE that this does NOT search article fulltext, only the extracted GKG fields.

Include ALL OF

Include AT LEAST ONE OF

Must NOT Have ANY OF

Intensity Weighting

How should the intensity of each day calculated?

  • Number Namesets As the GDELT Global Knowledge Graph processes each news article it extracts a list of all people, organizations, locations, and themes from that article and concatenates them together to form a unique "key" that represents that particular combination of names, locations, and themes. All articles containing that same unique combination of names, locations, and themes, regardless of how similar the rest of the text is, are grouped together into a "nameset". This option essentially weights each day towards those that occur in the greatest diversity of contexts, biasing towards days with many different contexts being discussed. It is relatively immune to sudden massive bursts of coverage (such as from a major sudden situation) and instead tends to capture the broadest temporal trends.
  • Number Articles This option bases the weights on the raw number of articles covering the search criteria on a given day. This option essentially weights each day towards those with the highest volume of coverage matching the search criteria, even if all of the coverage was of the same context, biasing towards frequency rather than uniqueness. It can be highly sensitive to sudden massive bursts of coverage (such as from a major sudden situation) and so should be used with care, but can yield a more nuanced and detailed picture of temporal trends, especially short-term temporal focus.

Outputs

The following output files will be generated:

  • Timeline Visualization Generates a static timeline visualization as a .PNG image. NOTE that the timeline is smoothed using a 7-day rolling window to smooth over the day-to-day movements of tone to make longitudinal trends clearer.
  • .CSV File This outputs a .CSV file containing the average tone by day. Unlike the timeline above, this reports the raw tonal data for each day rather than smoothing it, so you will want to perform your own smoothing before visualizing in most cases.